Charts
Examples of some charts below. Details have been removed or altered to protect privacy
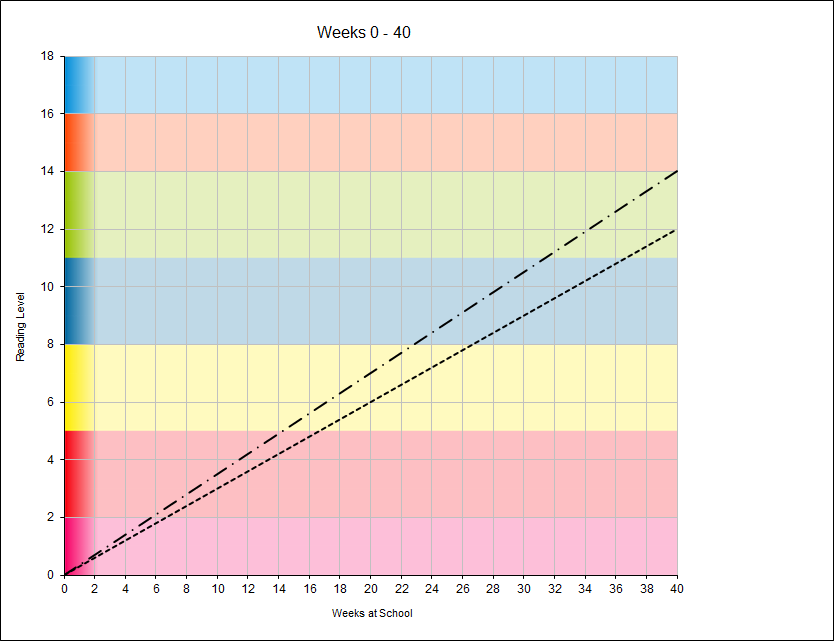
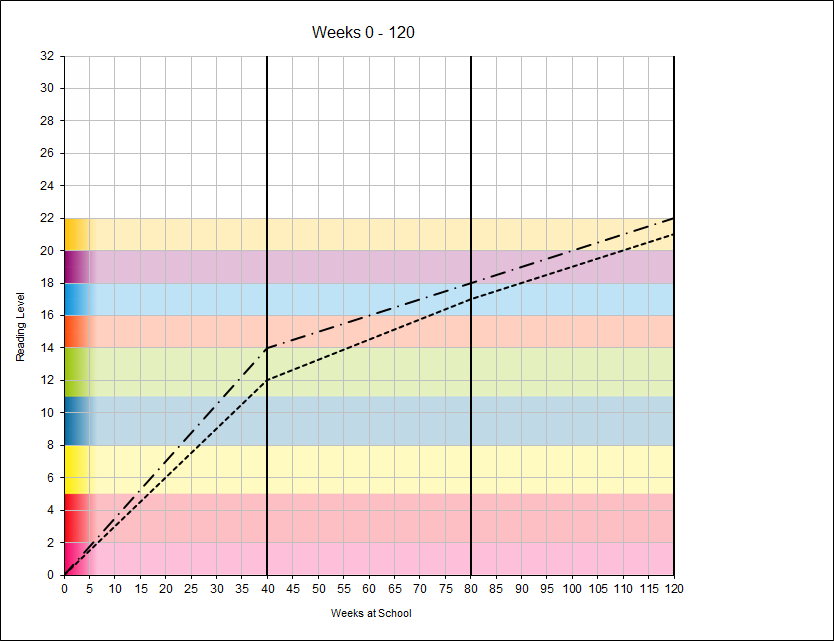
The first two two charts use an image as a background with the colours relating to the reading level colours. I deliberately faded the colours in most of the background image to avoid hiding the students achievement series.
 Back to Top
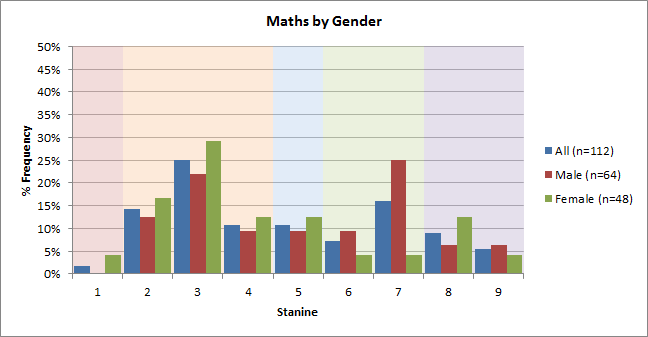
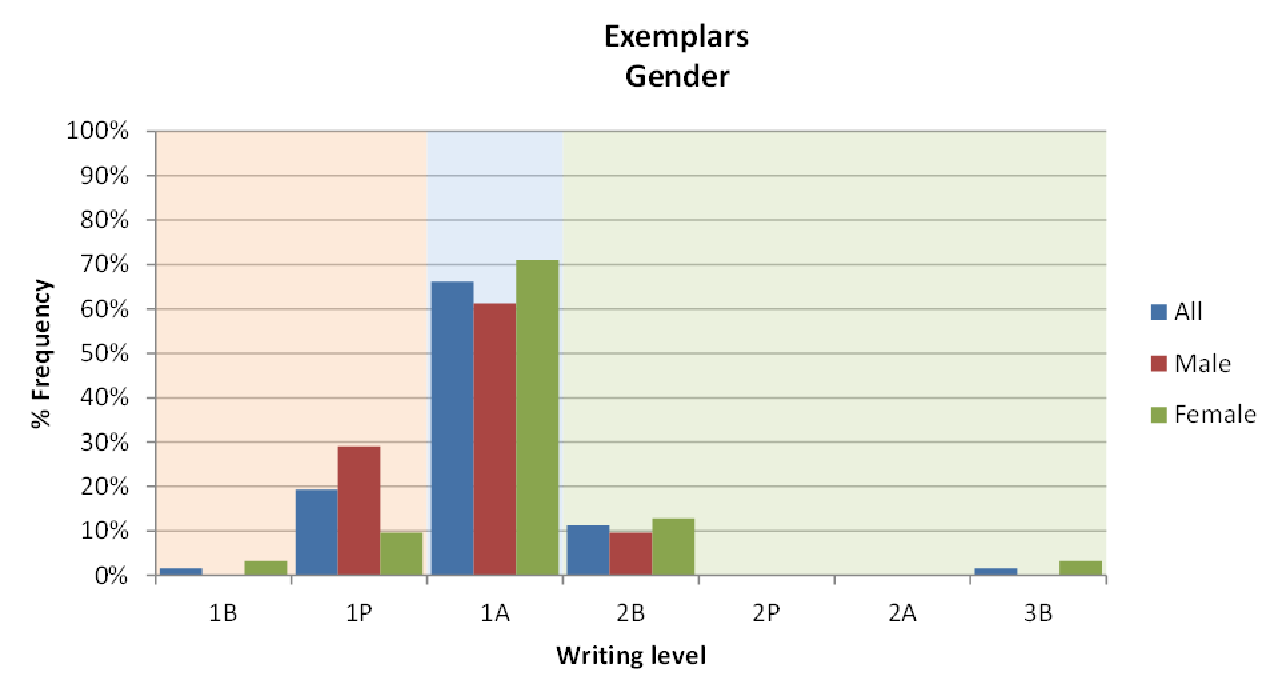
The next two charts below use a hidden series for the background providing additional information about the results. In the first the vertical coloured bands describe Well Below, Below, At, Above, and Well Above while in the next chart they define Below, At, and Above.
 Back to Top
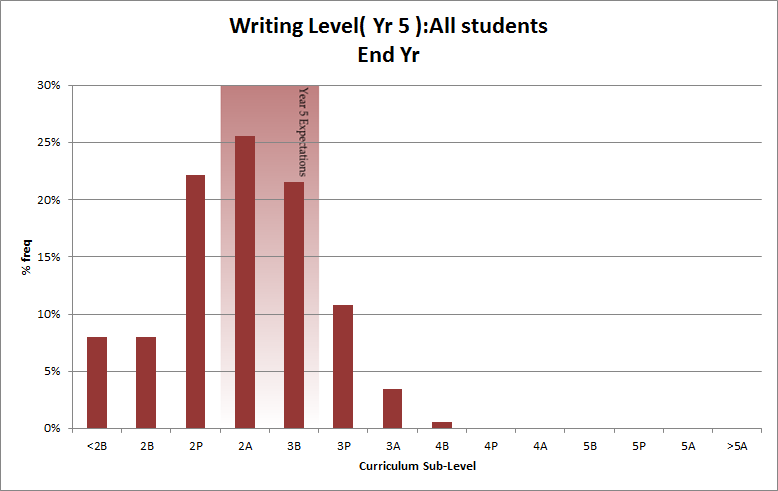
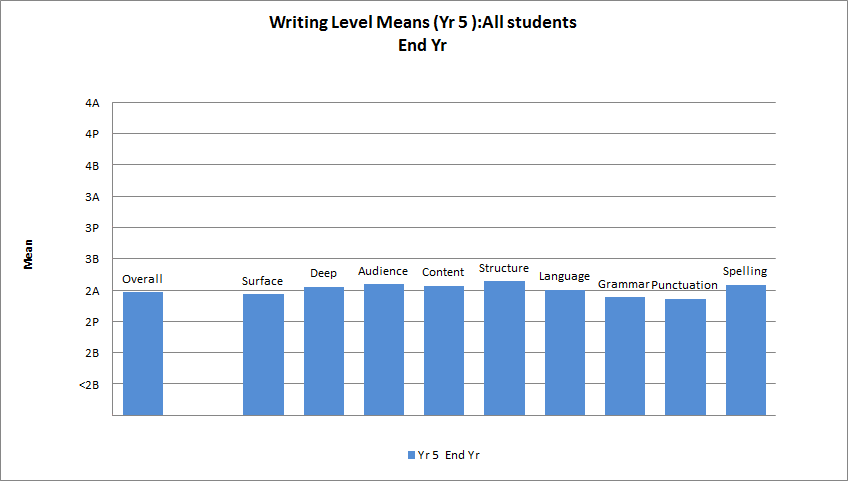
The following two charts are a pair. Each represents the same set of students.
The first chart uses an image as the background and shows the frequency of students achieving a sub-level while the second shows the student's mean sub level against curriculum sub functions.
 Back to Top
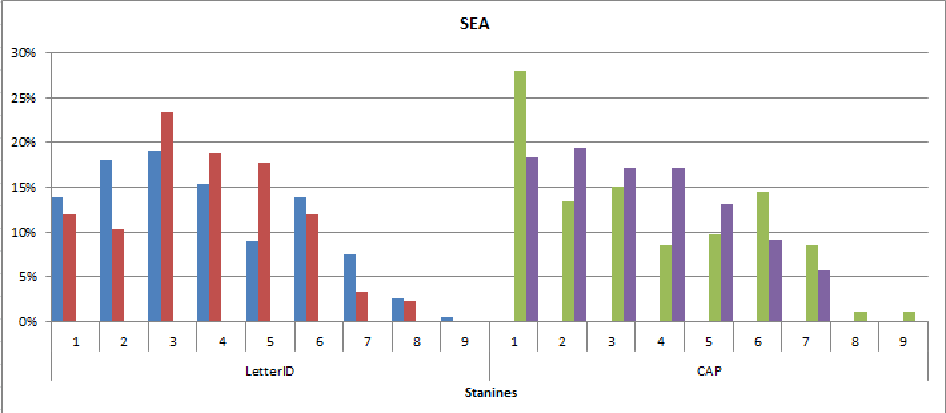
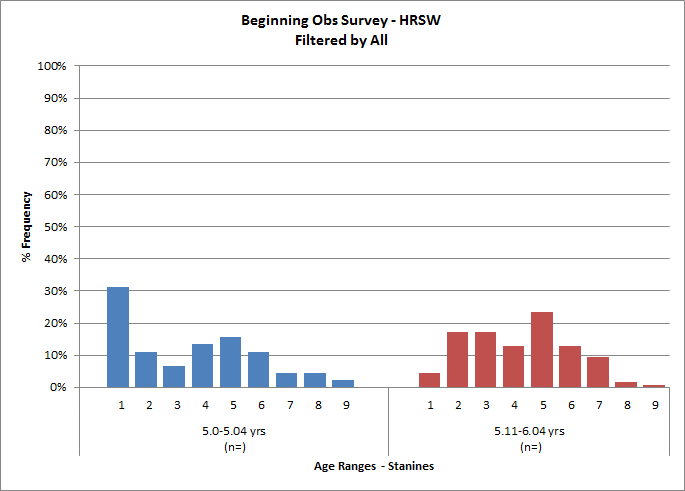
The first chart combines SEA LetterID and Concepts about Print at two time periods and the second chart combines a 6Yr Obs for two age ranges.
 Back to Top
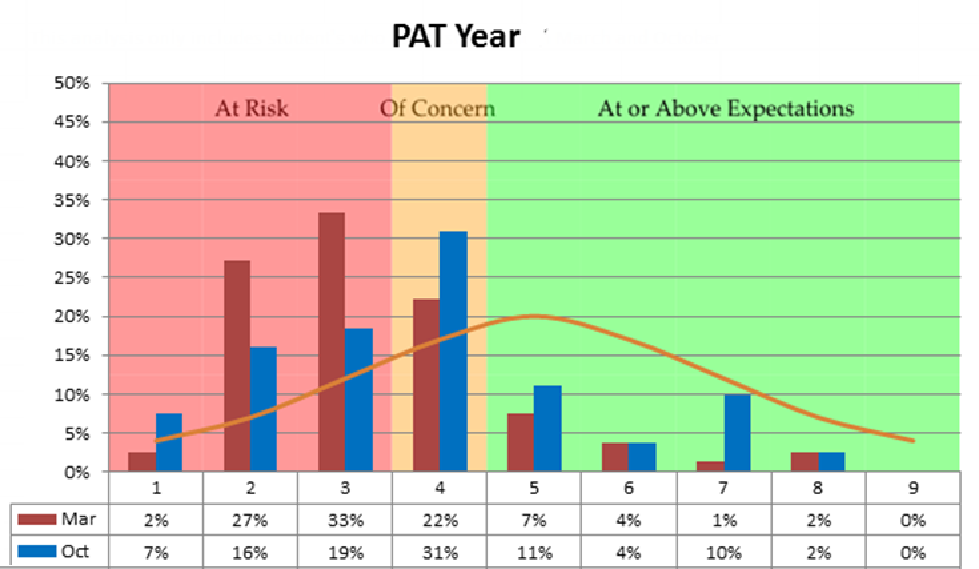
This PAT chart again uses an image as the background with a line showing National Norms. The image isn't as dynamic as a hidden series, as in the Exemplars and Maths charts but it does convey more information directly in the chart without having to have additional notes or make assumptions.
 Back to Top
If you have any questions or queries you can contact me at info@lesnalder.co.nz.
